


Gather Insight From Your Metrics
Summary
A website generates lots of numbers representing how visitors behave. What numbers are important, and what numbers can translate to some measure of “success?”
Does This Apply?
You can’t make well-intentioned, positive change if you don’t know where you’re currently at, so understanding the scope of web analytics and all of its acronyms and unique terms is important for the forward progression of your site. Once it’s launched, your only direction for maintenance should be “make it better.” Tracking metrics and understanding the numbers is how you do that.
Narrative
Throughout the existence of modern homo sapiens, survival and culture has relied deeply on patterns. Much of our recorded history has been spent looking for and documenting patterns: calendars were created by observing the stars and the patterns in seasons, and the patterns of success and failure within agricultural science helped shape not only what and how we eat, but the entire scope of human civilization.
Of course, we talk about patterns as if they’re preordained, when in fact they’re more fluid and natural than we’d like to admit.
Patterns are important only because they provide insight into why something is happening. A single data point might spur a small decision – a cold night might lead you to cover your freshly potted plants – but a pattern might lead you to simply not pot those plants until later in the season. However, the insight gathered from both of these might lead you to a new solution: the issue isn’t with the weather, but with the plant being potted in an unstable environment.
In other words, it’s not just about finding patterns and reacting. It’s about tracing those patterns back to the source to figure out why they’re happening.
It’s not data, it’s insight.
We make changes, we understand life, and we make sense of our surroundings by looking for patterns and reacting to them, either on a macro level or a micro level. The same can be said when we’re trying to understand the people who are coming to our site. We never see them, but they’re there. And we want to know what they’re looking for – and why they chose us.

Episode 8: Gather Insight From Your Metrics (w/ Jon Crowley)
Corey and Deane talk about the first time they tracked analytics on their blogs in the early 2000s. Then, Jon Crowley, Senior Vice President of Strategy at Diamond Marketing Group, talks to us about the balance between data and insights — how to focus on questions rather than raw numbers, how to look for answers rather than “trying to be correct,” and a when we can take data at face value. (He also gives us a tour of his shoe collection.)
Why Data Is Important
Despite our best intentions, we can’t interview every person who arrives on our site. But, in a way, if we have a sophisticated enough measurement tool installed on our site, we’re already interviewing them.
Knowing where and how people interact with your site, through the data gathered with these tools, can be the catalyst for change. Or, it can be a warm security blanket, confirming that everything is running as expected.
It can also be a lot to understand, which is not helped by the fact that it’s not something you can directly control. It’s out of your hands, which makes it scary and frustrating.
That’s okay. Scary and frustrating will pass. The larger goal is to understand how to use this data to your advantage. You don’t need to be a wizard at Google Analytics, but you do need to make some basic strategic decisions – and then find someone who can help you monitor those decisions.
First, we need to know what to measure in the first place.
Determining What to Measure
Let’s define a few things.
When we talk about data, we’re talking about raw information and individual numbers. For example, data is how many people arrived on your site today, how many people completed a purchase, or how many broken links a site crawler found.
When we talk about metrics, we’re talking about the system by which something is measured, or we are talking about the results of that system. For example, if we want to know how many average site visitors we have every day, we can take our data points (Monday’s visitors, Tuesday’s visitors, etc.) and grab the average. That is the metric.
Finally, when we talk about insights we’re talking about the patterns and inferences that arise from our data and metrics.
You can see that we’ve moved from raw data, to calculations based on that data, to interpretations of why that data is happening. It’s in these insights – not the raw data, but the thoughts and context around that data – that you find actionable web solutions.
Jon Crowley, in his talk “Your Funnel Isn’t a Journey: Data vs. Insights,” outlines the need for insights over data, when he talks about our need for solid and real answers. We want data to be real, as Crowley explains. We all “deeply want to believe that there’s some pure unvarnished truth in the world.” But, in fact, there’s insight behind that data – the “why” behind the data and activities – and that insight provides a lens that we can use to guide our thinking.
You can think of it this way. Your data provides fuel for your metrics, which (in concert with your knowledge of audience behaviors and a little common sense) can give you insight into the patterns. You have numbers, you have math, and you have interpretation.
Tying Metrics to Goals
Now that we’ve got those terms figured out, let’s dive a bit deeper. First off, you need to know what you want to measure.
There’s an easy (and dangerous) assumption that tracking numbers is good enough; that hooking up that Google Analytics account is going to provide deep insight into how people are using your site, or that wading through old numbers will help you create a more useful plan for your new web project. In reality, those numbers aren’t useful if they’re not telling you what you want to know.
So, what do you want to know? Believe it or not, that’s the easy part. If you’re following along chapter-by-chapter, you’ve:
- Defined goals for your business.
- Defined goals for your site.
- Defined goals for meeting your audiences’ expectations.
Now, we need to look at which metrics will help us gather the insights that we’ll need1. Trust us when we say you have a lot of options. We see metrics fall into the following groups:
- Activity: Simply tracking what someone is doing.
- Conversions: Tracking the likelihood someone does what you want them to do.
- Value: Often based on conversions, how much is each visitor worth to our process.
- Language: The words that people use to connect with us.
- Engagement: The act of spreading our message beyond their visit.
- Performance: The technical details of your site.
Which of these you choose to focus on is going to differ from site to site, and from goal to goal. For example, let’s say your organization provides access to services for those who have addiction problems. If one of your site’s goals is to get people to call your addiction coaches, then there are a few things you can measure:
- The words that they’re using to find us – language.
- The path they take to get to the coaches page – activity.
- The percentage of people who get to a certain point and select our call to action – conversion.
- The number of people who engage with our social media posts about new coaches – engagement.
At the same time that you’re tracking these metrics, you might also understand how crucial it is to keep, for example, an emergency connection to a counselor up and running, which means performing some kind of periodic test to ensure that page is actively published and accessible (performance).
Before you go chasing every stat and metric, keep in mind you don’t need to know everything at once. While there is in rare occasions a need for multivariate adjustments2, often making changes along more than one metric at a time can be detrimental to finding an actual solution. This is where Eric T. Peterson, in his book Web Analytics Demystified: A Marketer’s Guide to Understanding How Your Web Site Affects Your Business, urges those tackling web analytics to “think micro, not macro.” He says:
The biggest mistake businesses make is trying to change too much at once and then not being sure what actually caused any observed results. Give yourself a fighting chance! There is more than enough variability inherent in the internet itself without adding more complexity to the mix.
But the fact remains: you need to start somewhere, so find a goal and work backwards.
The Funnel
You’ll hear a lot about funnels when it comes to measuring conversions. Marketing people are very into it, for good reason: a well-optimized conversion funnel is going to drive traffic toward the actions they (and you) hope to accomplish, and measurement of that funnel is how you make change happen.
The concept is based on the idea of engagement and traffic as a kind of funnel. For every person who is aware of a site, a smaller number will actually engage in research on your site, from which an even smaller number will actually start making a decision on your site, which will ultimately lead to the smallest number of people: those who actually make a purchase3. The percentage of people who drop out of this process is called, predictably, the “dropout rate.”
Essentially, your potential customers go through four stages:
- Awareness: They know about your product.
- Interest: They have interest in your product.
- Desire: They want to have your product.
- Action: They actively get your product.
This is a very commerce-centric process, but funnels can be determined for any conversion, whether that’s signing people up for your email newsletter or getting people to fill out an online petition. The benefit of knowing what happens at each step of this funnel is tied to understanding the movements your users make as they get closer to fulfilling their expectations and outcomes.
Determining How to Measure: Diving into KPIs
Once you’ve decided what you want to measure, it’s time to figure out how to do it. What you need are some KPIs.
KPIs, or key performance indicators, are quantifiable metrics that are used to measure – wait for it! – performance toward your goals. They sometimes have crazy acronyms and jargon-filled titles, but they’re useful viewports into how your site is performing and what people are doing when they arrive.
A Short List of Important Data Points and Metrics
There are a lot of potential data points and metrics out there, and we want to help you understand the most common or important ones.
- Visits/Unique Visits: A visit, or a user session, is the instance in which a person or crawler4 is accessing the site as a whole. Unique visits are going to filter out multiple sessions by the same user.
- Views/Unique Views: When a person or crawler visits your site, they are going to view pages. Views are the number of times a page has been visited. Much like with visits, unique views filters out multiple views by the same visitor.
- Click-through/Click-through Rate (CTR): If a person lands on a page, that is a “visit,” or sometimes a “hit.” If a person then leaves your page to interact or engage with something like a “call to action,” that’s a “click-through5.” Click-through rate measures the percentage of people who land on a page and travel forward via that specific interaction.
- Conversion Rate: A multi-layered metric that consists of two things: defining a “conversion” (i.e. one newsletter sign-up or one sale of a product) and then measuring the percentage of people who make it from the start of the site through to the end of the conversion. Essentially, what percentage of people coming to your site do what you hope they do? You can tie this in with other data points to pull metrics like Average Revenue per Visit or Average Visits Prior to Conversion.
- Referrals: Literally, the digital source from which someone arrives on your site. In many cases, this is going to be a Google search, which means you’ll need to know the terms they’ve used to get there.
- Bounce Rate: Bounce rate measures the percentage of people who leave the site without visiting another page or performing an action. A high bounce rate is not necessarily a negative thing; if the purpose of the page is to deliver a user to a separate online portal, you want them to bounce from your site.
- Time on Page: How long is the average person staying on your page? This depends on context. If you’ve written a very long blog post, a time on page of eleven seconds isn’t great. But if you’ve created a page that serves as a quick landing page before another decision, that short eleven seconds is ideal.
Setting a Baseline
In baseball, there’s a concept called the Mendoza Line. It was coined in the late 1970s by teammates of Mario Mendoza, a defensive specialist who struggled to hit above .200 (a very poor average) for most of his early career, and is used to describe hitters who struggle early in the season – especially those hovering around .200. Once the term reached anchors for the then brand new SportsCenter on ESPN, it became endearing to point out hitters hovering around the Mendoza Line.
The Mendoza Line set a baseline for what it means to be a competent hitter. Without the Mendoza Line … what is that cutoff?
Baselines provide an anchor to your data and metrics. Otherwise, your numbers float without reference, of little use and unspectacular.
For example, we can measure a hundred people’s heights and get an average height. But without a baseline, that number is of no use. How do we use it? We need a baseline:
- We can compare it with the average height of people who live in the United States.
- We can compare it with the average height of a professional basketball player. Or, maybe we compare it with the average height of a professional jockey.
- We can compare individuals within the group against the average; in this case, the baseline is determined by the average, and individual people are compared against the average.
Baselines don’t just appear. Sometimes we just need to make a baseline happen. Too often we come in contact with clients who are frozen with fear that they’ll choose the wrong baseline, or they’ll track the wrong metrics, when in reality they simply have to take a stab at a number. Any number.
There is no correct number for your conversion rate, or for your time on page, or for your percentage of traffic from search. There’s just the number you have, and the number you want to try to reach.
And when all else fails, look into the past. If you have data for the last three months, review it and make a decision based on those numbers.
Understanding How People Consume
One key difference between tracking metrics and making inferences from those numbers is that raw numbers show you activity, while the research around those numbers – the actual analytic interpretation – shows you habits and trends.
Let’s use page referrals as an example. Viewing your page referrals will give you a total number of visits from a specific page. This is the data. You know that people are coming from a specific site more than any other, because a number is telling you this.
Interpreting this data to be useful depends on making some assumptions and going a little deeper in your research.
- Why are people coming from this site?
- Are there clues on this page that help you understand why people are drawn to the link or reference?
- Is this page showing up in search instead of yours, and so traffic drives through an external page before it’s coming to yours?
- Are there improvements that can be made on your page based on the findings from this page?
When it comes to reading data, know that the number usually means nothing. It’s a clue, like Sherlock Holmes finding a paper trail; it requires a bit of deductive reasoning to reach a conclusion that warrants action. You don’t need to know the percentage of people that abandon the shopping cart as much as you need to know the reasons they are doing so. The number is the clue, and the action depends on research and due diligence.
Beyond Google Analytics: Other Ways to Measure
Of course, there’s more than just Google Analytics and traffic numbers when it comes to understanding your site. You can track words, and you can compare pages against each other, and you can even … talk to real people face-to-face. Like we’ve said before, the way you find your insights might have nothing to do with Google Analytics at all.
While Google Analytics and other site analytic tools can provide a ton of information tied to search and traffic, other metrics include:
- Seeing where users click on your page using heat mapping or session-recording tools.
- Finding issues with common forms and their fields using form-analytics software.
- Finding external messaging and mentions through social and external serach.
- Finding non-trackable issues through person-to-person user testing and eye tracking.
Some of these require a big budget and a lot of time, especially when working with real people in distributed locations. But beyond some of these more lofty goals, there are more common ways to look beyond web traffic and conversion rates to find out how we’re performing and what we can do to change: language, comparison, and feedback.
Measuring Language
Data and metrics aren’t just numbers. They often represent something even deeper: words. The words people use to find your site, and the words that people use to navigate your site.
Every day, people are providing you with data on the types of things they expect to find. They’re typing words into a search field and either finding what they want (hooray!) or not finding what they want (aw, nuts!). For external search, you have answers to the first. For internal search, you have the answers to both.
- External Search Data: Your analytics tool will provide you information on what search terms were entered before someone arrived on your site. The more common the search term, the higher it will show in your reports.
- Internal Search Data: If you have an internal site search set up, you will be able to see any term searched by people from anywhere within your site.
More importantly, you’ll be able to get clues about what words aren’t easy to find. When someone can’t find something – either because they’ve searched everywhere and are lost, or because they arrive on the site and immediately “nope” themselves away from your weird navigation or video carousel – they almost always turn to the on-site search.
Lou Rosenfeld, in his book Search Analytics for Your Site, talks about two areas of analysis within your internal search:
- Pattern Analysis: What trends do you see in how people search your site? Are they using technical terms or more general terms? Are they depending on synonyms? Are they using jargon or abbreviations?
- Failure Analysis: Are common search terms returning non-relevant or, even worse, no results?
The book goes further into framing this analysis, whether it’s session by session, per audience, or per goal, but even doing this basic level of research into what words are used and how results line up will reap the benefits.
Search Trends
Do not forget that relevant data for your site does not always come from your site. There is a world of data that comes from people who will never touch your site – the world of search trends.
Search trends, specifically a tool like Google’s Trends, allows you to see both what and how people are searching across the world.
This is especially useful when your data and metrics uncover search terms that seem out of place. Let’s say, for example, that you manage a site for a local health center specializing in care for those with Alzheimer’s, and on-site search data for your site shows a rise in the term “dementia.” A quick look at Google Trend will show that while searches for Alzheimer’s as a specific condition are staying even over the past fifteen years, the more generic term “dementia” is on the rise. Integrating the term “dementia” more clearly into the site, or even creating a page that compares the generic “dementia” to the more specific “Alzheimer’s Disease” will clearly be of benefit to those who visit your site.
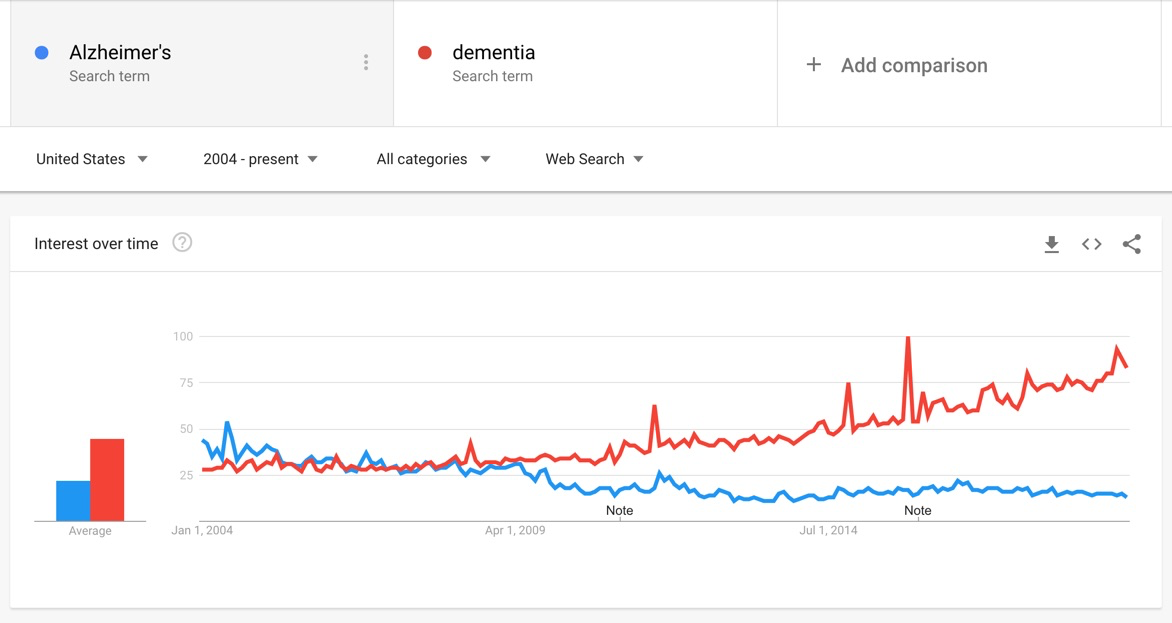
Figure 8.1: Google Trend results for Alzheimer’s vs. dementia over the past fifteen years.
Comparing Options: A/B Testing
If you’re using data to figure out a choice between two common pieces of content or design styles, you’re often looking at A/B testing. A/B testing provides site visitors one of two choices by random7, allowing you to actually measure which of the two choices is most successful.
For example, let’s say you are running a web campaign that feels lacking in how it moves traffic from the home page to your hoped-for destination.
To run an A/B test, you just need another idea: design an alternate campaign block, or move the campaign block, or even remove it altogether to test the current campaign against a control group.
- The same concept of “micro over macro” applies here – multivariate testing can potentially provide too many potential reasons for a change; A/B testing allows you to know exactly which one worked.
Now, when users hit your site, they’ll have a 50% chance of reaching one version or the other. Tracking these metrics will tell you which converts better, allowing for constant iteration toward a better campaign.
Getting Personal Feedback
We talked about this at length in the chapters Identify Your Audiences and Identify Outcomes and Expectations, but it’s important enough to repeat over and over: knowing your people and how they feel is the most genuine and valuable thing you can do to measure success and gain insight. This kind of personal feedback can be collected in multiple ways:
- Live Chat: Typically seen as a customer service outlet, live chat can also provide you with as it happens access to customer pain points, both with your product and with your site processes.
- Surveys and Questionnaires: People typically don’t fill out surveys unless they’re angry about something, so don’t expect a lot of kudos, but you can expect some real talk about what’s not working.
- User Testing: On-site, periodic user testing can provide you with an unfiltered look at how people travel around the site, and their comments will fill knowledge gaps that raw data can’t provide.
Regardless of how you get it, what’s important is that you do something with it. Tracking data and finding insights is an act of pure masochism if they’re not backed by action. We’ve talked about knowing your content through inventories and audits, and we’ve now discussed combing through data to infer insight. Now we’re going to dive right into that content itself.
That’s right: in chapter nine we’re finally talking about content strategy!
Inputs and Outputs
First off, you need to track your data. You need some kind of analytics package set up on your site to measure who, where, and what is active. (The obvious source for this is Google Analytics, but this also comes from individual social media data, internal feedback, and even content management system reporting.)
From this, you’re going to get reports. Reports are good if you know why they matter, and they’re just noise if they don’t match a business goal.
The Big Picture
During discovery, you want to see numbers so you can get a good idea of what people are doing and how it might change (or improve, or even decline) on a new site. Beyond that, though, you’ll constantly monitor data and metrics to glean insights for the future of your site, so understanding your metrics is an ongoing governance and maintenance task.
Staffing
Staffing your analytics and data roles might come from a handful of areas. Sometimes, you might have a dedicated analytics person, especially in a high-conversion business like retail, where small changes in a user’s path can lead to a drastic shift in revenue. If you are a smaller organization, you might have someone who glances at your Google Analytics every once in a while, so work comes in focusing on the right metrics to help your business measure goal progression.
Your marketing and web team are going to want to know what’s happening, so this role can often come from those departments, or if you’re a larger organization, this work might be outsourced to specialists, who often also help determine online advertising.
Resources
Books
- Search Analytics for your Site by Louis Rosenfeld
- Making Websites Win by Dr. Karl Blanks & Ben Jesson
- Outside-In Marketing by James Mathewson & Mike Moran
- Web Analytics Action Hero by Brent Dykes
- The Digital Crown: Winning at Content on the Web by Avaha Leibtag
- SEO for Everyone by Rebekah Baggs & Chris Corak
Files/White Papers
- Web Analytics Demystified: A Marketer’s Guide to Understanding How Your Web Site Affects Your Business by Eric T. Peterson
- The Big Book of Key Performance Indicators by Eric T. Peterson
Presentations
- “Your Funnel Isn’t a Journey: Data vs. Insights” by Jon Crowley